


US Statistics- Speaking of Research
Author: US Statistics
https://speakingofresearch.com/facts/statistics/
0 General Document comments
0 Sentence and Paragraph comments
0 Image and Video comments
US Statistics


In 2017 US government statistics put the number of laboratory animals used in research at 792,168, a decrease of 3.5% from 2016. The above graph shows the breakdown of different species used. It is important to note that these statistics do not include rats, mice, birds or fish, as these animals are not covered by the Animal Welfare Act – though they are still protected under other regulations.

 Precise figures for the number of mice, rats, fish and birds used in research do not exist and thus it is not possible to accurately estimate the total number of vertebrates used in research.
Across the EU, 93% of research is conducted on animals which are not counted under the US Animal Welfare Act.
If the same was true in the US then the total number of animals used in research would be approximately 12 million, however this is only an estimate and we have previously suggested the total figure could be as high as 27 million.
Precise figures for the number of mice, rats, fish and birds used in research do not exist and thus it is not possible to accurately estimate the total number of vertebrates used in research.
Across the EU, 93% of research is conducted on animals which are not counted under the US Animal Welfare Act.
If the same was true in the US then the total number of animals used in research would be approximately 12 million, however this is only an estimate and we have previously suggested the total figure could be as high as 27 million.
Given the assumptions made above on the number of other species used, it likely that dogs, cats and non-human primates together account for 1% or less of the animals used in research every year.

Government statistics show that the use of non-rodent animals has been declining over the past two decades. Since 1985 the use of animals has more than halved in the US. This includes a fall in the number of dogs from over 200,000 in 1979, to around 60,000 in 2015. Some of this fall is likely to reflect a movement towards the use of genetically modified mice.
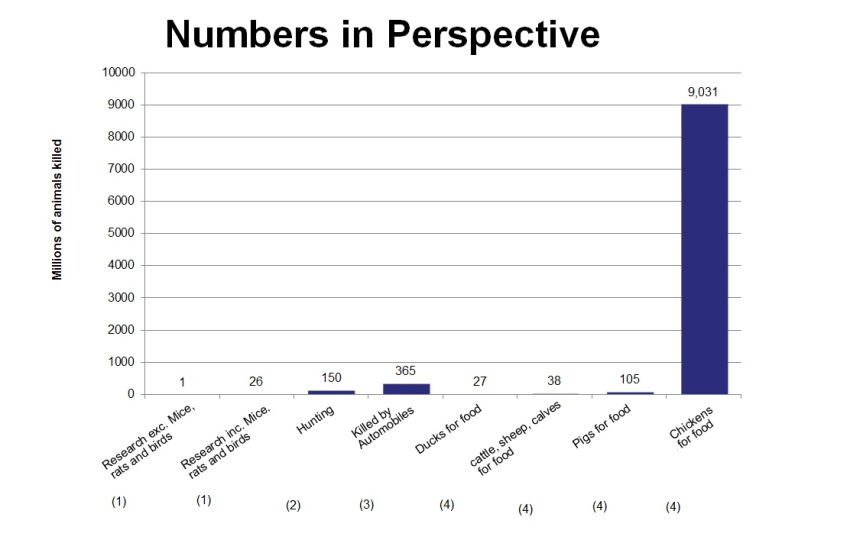
Let us put the number of animals used in perspective. Scientists in the US use approximately 12-27 million animals in research, of which only less than 1 million are not rats, mice, birds or fish. We use fewer animals in research than the number of ducks eaten per year in this country. We consume over 1800 times the number of pigs than the number used in research. We eat over 340 chickens for each animal used in a research facility, and almost 9,000 chickens for every animal used in research covered by the Animal Welfare Act. For every animal used in research, it is estimated that 14 more are killed on our roads.
General Document Comments 0


0 archived comments